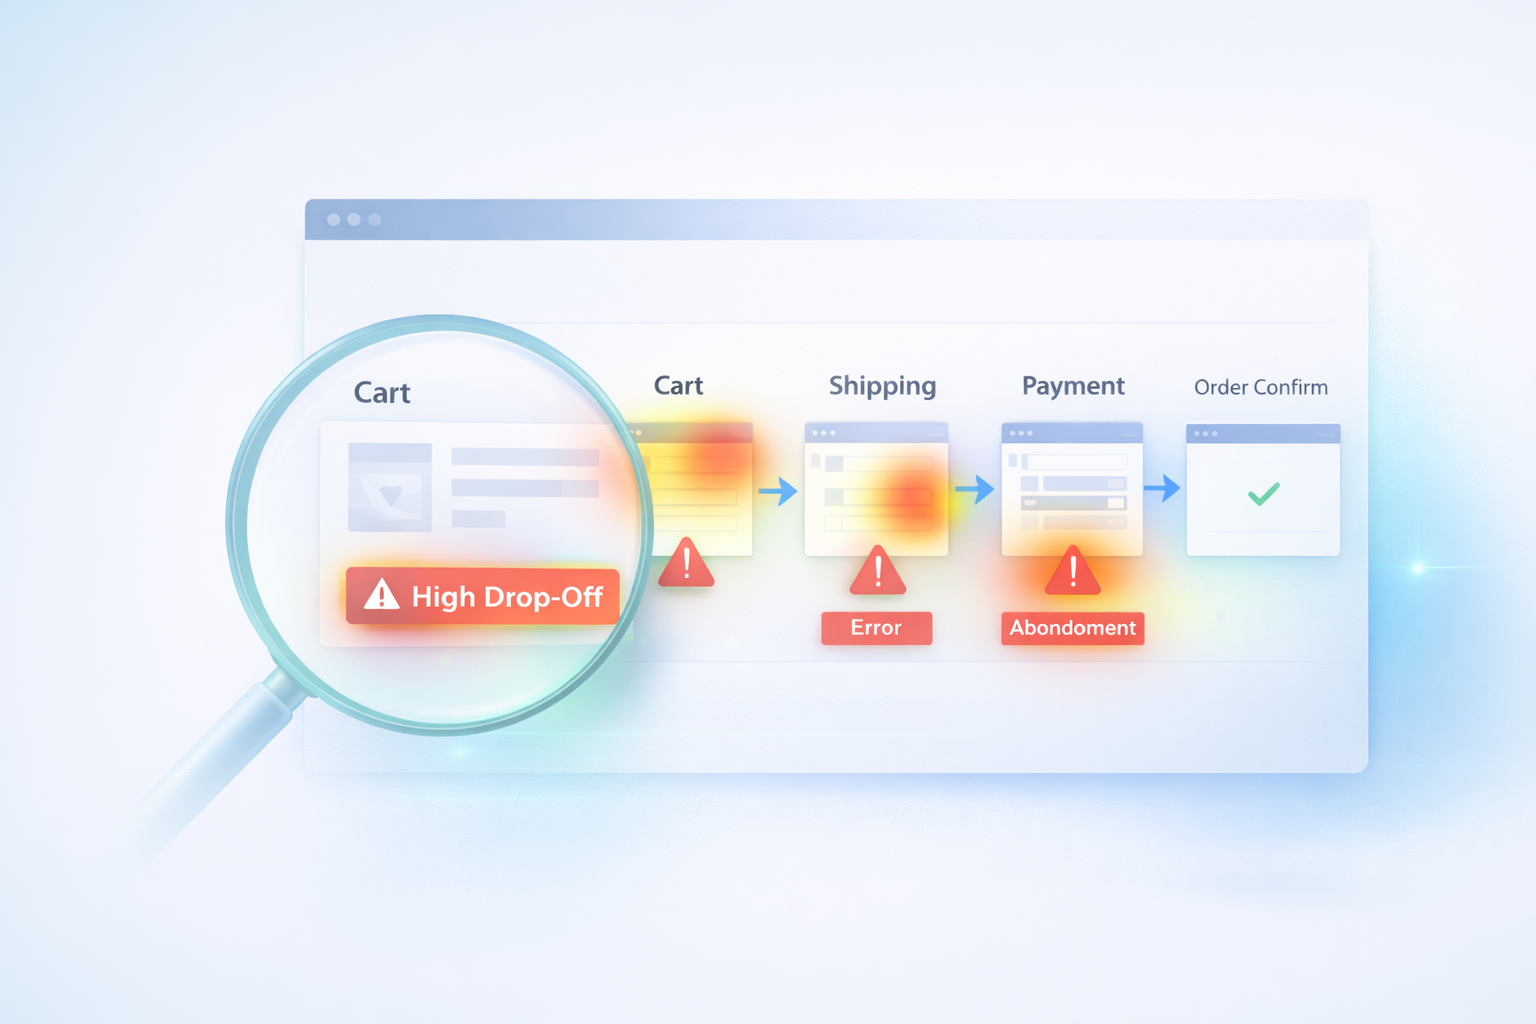
Cart Abandonment Forensics: 12 Friction Signals You Can See in Session Replays
Cart abandonment isn’t a mystery.
It’s a pattern.
Most ecommerce stores treat abandonment like a statistic:
“Our cart abandonment rate is 68%.”
But that number doesn’t tell you why customers leave.
Session replays and interaction data turn abandonment into something visible — something diagnosable.
This guide walks through the 12 friction signals that repeatedly show up before customers exit.
First: Not All Abandonment Is Equal
Some users were never going to purchase.
But high-intent abandonment — the kind that costs real revenue — usually shows one or more behavioral signals before exit.
You’re not looking for random drop-offs.
You’re looking for patterns.
12 Cart Abandonment Friction Signals
1. Hesitation After Price Updates
When totals change (shipping, tax, fees), watch for:
- Pauses
- Scroll searching
- Immediate exits
Unexpected cost = conversion cliff.
2. Rage Clicks on Checkout Buttons
Repeated clicking often signals:
- Broken button state
- Delayed response
- Confusion about next step
(See our guide on rage clicks for deeper analysis.)
👉 Internal link to Post #2.
3. Form Error Loops
Users re-enter:
- ZIP codes
- Credit card numbers
- Email addresses
Multiple attempts = unclear validation.
4. Mobile Scroll Hunting
Rapid scroll up/down during checkout often means:
- Looking for totals
- Searching for trust signals
- Trying to find next button
Mobile abandonment is often layout-related.
5. Variant Confusion on Product Page
Before cart even fills:
- Size selection unclear
- Out-of-stock not obvious
- Required options hidden
Users abandon before frustration escalates.
6. Dead Clicks on Images or Icons
Users expect images to:
- Zoom
- Expand
- Show alternate views
If nothing happens, confidence drops.
7. Long Idle Pauses on Payment Step
If users pause:
- They may be verifying trust
- Comparing totals
- Checking shipping policies
Trust gaps often show up here.
8. Back-and-Forth Navigation
Repeated switching between:
- Cart and product page
- Cart and shipping info
Signals uncertainty.
9. Coupon Code Failures
Invalid code loops are a top abandonment trigger.
Especially if:
- Error message unclear
- No guidance provided
10. Shipping Method Confusion
Multiple shipping tiers can create hesitation if:
- Delivery times unclear
- Price differences unexpected
11. Payment Rejections Without Context
If payment fails:
- Does user know why?
- Is retry clear?
- Is alternate method visible?
Poor feedback equals abandonment.
12. Exit Immediately After a UI Shift
When layout changes:
- Accordion expands
- Page reloads
- Payment iframe loads
If users exit within seconds, the transition likely broke expectation.
How to Turn Patterns Into Fixes
Instead of watching random sessions:
- Filter by users who reached cart.
- Identify sessions ending without purchase.
- Watch in batches of 10–20.
- Track repeating behaviors.
- Prioritize by frequency.
You’ll notice recurring friction quickly.
If you haven’t yet identified which checkout step has the highest drop-off, start there.
👉 Internal link to Post #1 (checkout drop-off guide).
The Difference Between Data and Diagnosis
Analytics tells you:
“Users left.”
Behavior shows you:
“They left because the shipping cost appeared late and surprised them.”
That difference is where optimization happens.
Final Thought
Cart abandonment isn’t random.
It leaves fingerprints.
When you treat it like forensic analysis instead of a percentage metric, the fixes become clearer — and often simpler than expected.